Making memory side effects ordinary values in a compiler's intermediate representation
Overview
Whole-program, sound, interprocedural analyses are really hard to implement efficiently and correctly.
They have to work on the entire program at once and handle every detail that comes with that: context sensitivity, function summaries, recursion, virtual calls, and so on.
That's why industrial compilers do most of their reasoning one function at a time, and rely on inlining to see a little further.
We want to sidestep this difficulty rather than solve it.
Our goal is to make side effects explicit in the program representation, so that analyses and optimizations can reason about them as ordinary data dependencies.
This post introduces the core idea, the representation we build it on, and the plan for trying it out in a real compiler.
Core Idea
The main idea is to represent side effects as explicit values.
A conventional function can be viewed as:
A function with an explicit state (or effect) token is the same function with one extra argument and one extra result:
f : state × arguments → result × state
The state token stands for the part of the program state that the function may observe or modify.
For I/O, for example, we can introduce a token called world:
io_read  : world × fd → value × world
io_write : world × fd × value → world
The important property is that the state is now a value, and values have data dependencies.
In the sequence
w1 ← io_write(w0, fd, 3)
w2 ← io_write(w1, fd, 4)
the second write needs w1, which only the first write produces: w0 → io_write → w1 → io_write → w2.
The order of the two writes no longer depends on the order of the statements. It is data flow, the same kind of dependency as the one between x = a + b and y = x * 2.
A nice side effect (pun intended): the signature now says what a function does.
A function that takes a world may do I/O. A function that takes no token at all is pure.
From I/O to the heap
The same trick works for memory.
We add a heap token and thread it through every load and store:
store : heap × ref × value → heap
load  : heap × ref → value × heap
With a single heap, though, every memory operation ends up on one chain, so everything stays ordered after everything else.
Instead, we split the heap into non-overlapping parts and give each part its own token:
counter_heap   -- the fields of Counter objects
logger_heap    -- the fields of Logger objects
config_heap    -- the fields of Config objects
Now look at two stores to unrelated objects:
c1 ← store(c0, counter.value, 1)     -- consumes and produces counter_heap
l1 ← store(l0, logger.count, 7)      -- consumes and produces logger_heap
Neither store needs anything the other one produces. There is no data dependency between them, so we are free to swap them, just as we could swap two pure operations like a + b and c * d.
Operations on the same part keep their order. A load of counter.value needs the counter_heap produced by the store before it, so it can't move above that store.
In short: operations connected by data flow must keep their order. Operations with no data path between them can be moved freely.
Code motion, and as we will see, removing dead code, then comes down to following data flow.
This only works if every effect is in the representation. Exceptions are effects too, and we will come back to them.
SSU
So what kind of representation suits these tokens? Well, let's construct it together.
The first important thing we must realize is that an effect token (heap, I/O, ...) is a perfect example of a linear value: it must be used exactly once.
A token can't be duplicated. Two operations consuming the same w0 would mean two different futures of the same world, and the program only gets one.
And it also can't be dropped. Throwing w1 away would mean forgetting that the write happened.
These are exactly the properties we would intuitively expect from an "effect" type.
Now suppose we track a world token through an if-else, where each branch does some I/O
When control flow splits, w0 has to go into both branches. That looks like a duplication, the one thing we just ruled out.
It's fine because only one of the branches actually runs. So this isn't a real copy, it's a fork into two mutually exclusive paths,
and we treat it as a different operation from duplication.
When control flow merges, we have w1 from one branch and w2 from the other, and we must join them into a single w3.
If that looks familiar, it should: it's a phi-node, exactly as in SSA.
This brings us to SSU, static single use form.
It is SSA with one extra rule: every value is used exactly once, not just defined exactly once.
If an ordinary value (an integer, a reference) is needed twice, the program has to say so with an explicit dup.
Effect tokens can't be dup-ed at all; the only way to split one is a fork at a branch.
Why bother?
Because in SSU every use of a value is visible, so the question "who observes this value?" can be answered by reading the graph.
For heap tokens, that is exactly what we want to know. Take:
c1 ← store(c0, counter.value, 1)
...                                  -- anything that doesn't use c1
c2 ← store(c1, counter.value, 2)
If the second store is the only use of c1, nothing ever observes the value 1, so the first store is dead, and we know that without running any analysis.
If something in between could read counter.value, it would have to take counter_heap, which would give c1 a second use.
We will meet this example again with real code.
Implementation
The concrete experimental setting for this work is Native Image, the ahead-of-time compiler in GraalVM.
Two of its parts matter to us:
- a whole-program points-to analysis, which works out which objects each reference may point to, and along the way, which fields each method reads and writes;
- the Graal compiler, which then compiles each method using Graal IR, a sea-of-nodes representation.
I wrote a separate post about how Graal models memory, and I'll refer to it several times.
The short version: Graal treats every call as if it could change any memory, and that blocks optimizations around calls.
The obvious fix is to tell the compiler what a call actually changes.
But the IR can only record what a call writes. Nothing in it can say what a call reads (well, there have been some attempts such as TESA).
Some optimizations, such as removing the dead store above, need exactly that, which is why we want both sides in the representation.
In the following sections, I will provide insights of the implementation and discuss important decisions made along the way.
Native Image runs its points-to analysis as one step of building an image.
Starting from main, it works out:
- which methods are reachable, meaning they might be invoked at run time;
- for every call site, which methods it may actually call, even when the call is virtual;
- the type flows: which types of objects may flow through each value in the program.
Almost all of this is useful to us.
From it, we export, for each method, the fields it reads, the fields it writes, and the methods it may call.
Where the export plugs in
We don't need an image, only the analysis.
Conveniently, the Graal repository also packages the points-to analysis as a standalone tool: the same analysis without the image build around it, running on an ordinary JVM against any classpath with a main.
Our exporter is a small Java program that uses it as a library.
It runs the analysis until it reaches its fixpoint, then walks the results and writes them out as JSON.
Nothing inside Graal calls the exporter, and nothing has to: once the analysis returns, every fact is final, and we just read them.
Exporting one of our examples takes a few seconds.
Which graph we export
The analysis doesn't work on bytecode directly.
It parses every reachable method into a Graal IR graph and builds its type flows from that graph.
We export that same graph, rebuilt the same way, so that the graph and the facts agree: the callees attached to a call node are the ones the analysis found for exactly that call.
Before building the type flows, the analysis tidies each graph up a little:
- canonicalization folds constants and simplifies expressions;
- conditional elimination removes conditions that are already known, mostly repeated null checks;
- partial escape analysis removes allocations of objects that never escape the method.
There is no inlining.
The standalone analyzer doesn't inline anything before the analysis (a full Native Image build would inline small methods at this point), and none of the compiler's later phases run.
A call in the source is still a call in the graph, and that's what we want: calls are where the interesting effects hide.
Escape analysis has one visible consequence.
An object that never escapes disappears completely, but one that does escape is only created at the point where it escapes, in a form our translation doesn't handle yet.
It can be switched off with -H:-EscapeAnalysisBeforeAnalysis.
What we export
The export has two parts.
The first is the facts, for every reachable method, JDK included:
"Examples.countInto(LExamples$Logger;LExamples$Link;)V": {
  "reads": ["Examples$Link.next", "Examples$Logger.count"],
  "writes": ["Examples$Logger.count"],
  "callees": ["Examples.countInto(LExamples$Logger;LExamples$Link;)V"],
  "allocates": false,
  "unknown": [],
  "unresolved": []
}
Methods are named together with their JVM descriptor, so overloads stay apart: our examples have two countIntos, one for a Counter and one for a Logger.
Besides reads, writes and callees, each method says whether it allocates, which of its memory effects can't be named by a field (a monitor, a volatile access, a fence), and which of its calls the analysis couldn't resolve.
The signatures need all three, as we'll see.
The second part is the graphs of the program's own methods.
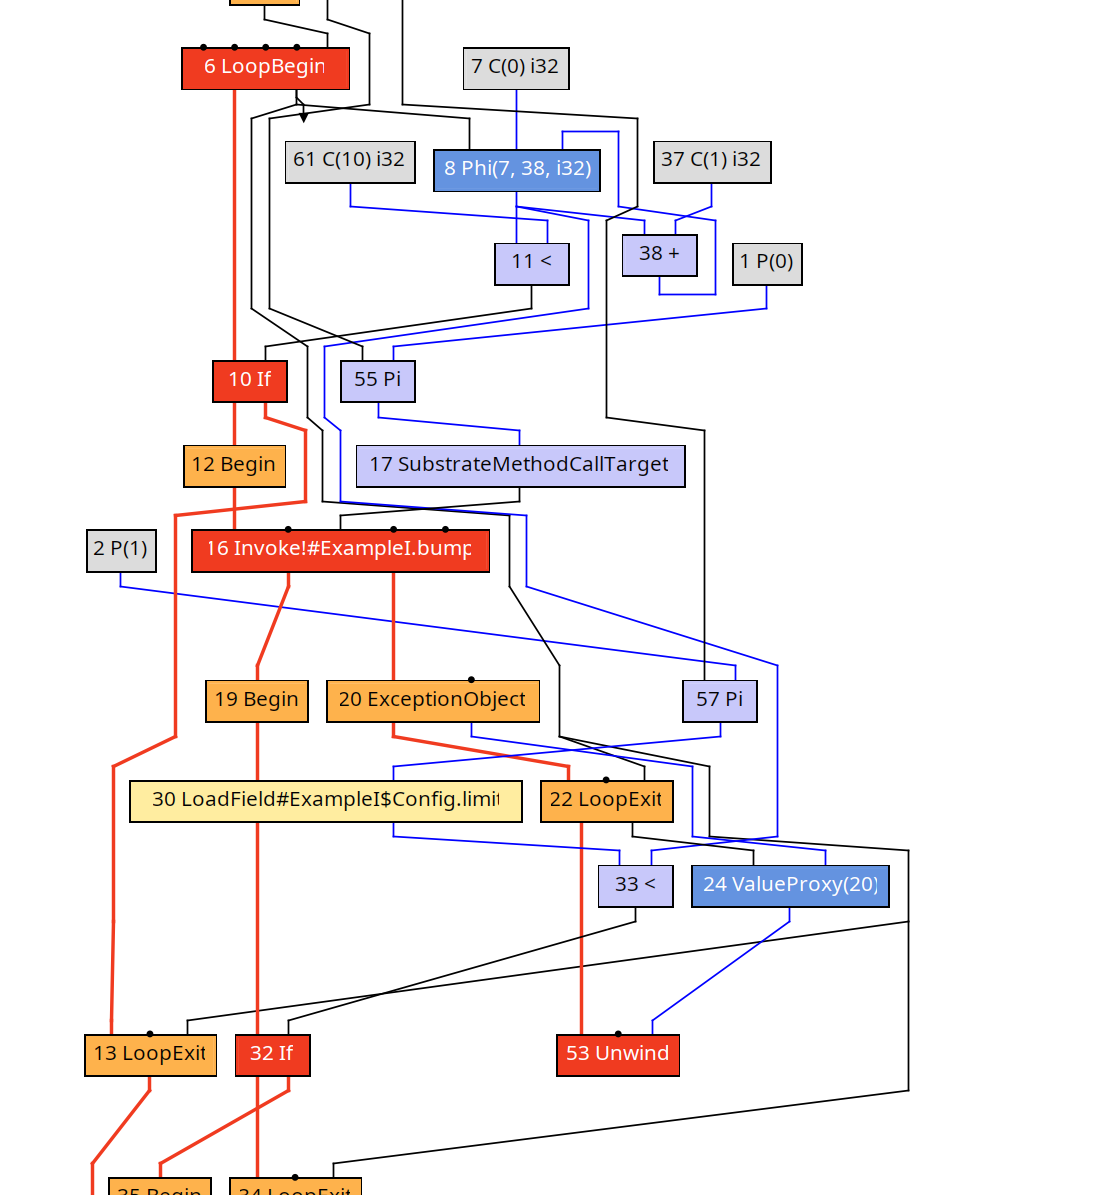
Graal IR is a sea of nodes with no fixed order, so we ask Graal to schedule each graph and export the result: basic blocks with their predecessors and successors, and in every block, its nodes in order.
A call node carries what the analysis found out about it:
{"id": 27, "op": "InvokeWithException", "args": [1, 25], "bci": 19,
 "target": "Examples.countInto(LExamples$Logger;LExamples$Link;)V",
 "callees": ["Examples.countInto(LExamples$Logger;LExamples$Link;)V"]}
Here 1 is logger and 25 is the load of link.next.
Everything after this point, the signatures and the translation, works on this JSON alone.
Things we learned the hard way
At first we exported facts only for the program's own methods.
Then every constructor, and every method that creates an object, looked like it could touch anything, because every constructor calls Object.<init>, which had no facts.
So now every reachable method gets facts, and the JDK's fields go into the rest of memory.
The analysis records field accesses in its type flows, but only for the kinds of values it tracks, and float and double aren't among them.
So the exporter also reads field loads and stores off each graph; otherwise a method that writes a double field would look like it writes nothing at all.
And the analysis believes what it sees.
System.out is set by native code, so as far as the analysis can tell, it is always null.
It concludes that every System.out.println throws, and treats the code after it as unreachable.
That's why the printlns in our examples come last.
Heap Modelling & partitioning
The simplest heap model is the one from the start of this post: a single heap token, threaded through every load, every store and every call.
It is trivially sound, because nothing can ever be reordered, and it is exactly as pessimistic as that sounds.
Every memory operation sits on one long chain, and every call is ordered against everything, which is more or less where Graal stands whenever it meets a call.
To do better, we cut the heap into pieces.
Cutting is only safe if the pieces really are separate.
A partitioning is sound when every memory location belongs to exactly one partition.
At least one, so that no store slips past the tokens unnoticed.
And at most one, so that two operations on the same location can never end up on two different chains, where they would look independent and could be swapped.
So how do we cut?
The overview split the heap by class (counter_heap, logger_heap).
The implementation goes one step finer and gives every field of the program its own partition, named by its declaring class and name: Counter.value, Counter.other, Logger.count.
Fields are attractive because Java's type system already guarantees they are disjoint: counter.value and logger.count are different memory no matter which objects counter and logger point to.
We don't have to ask the points-to analysis to know that, so we can't be misled by it either.
(The ways around the type system, such as Unsafe, JNI and reflection, end up in code we treat as touching everything, as we'll see shortly.)
The price is that all Counter objects share one partition: stores to a.value and b.value stay ordered even when a and b are different objects.
Splitting further, say by allocation site, would make soundness depend on the points-to analysis being right.
That's a story for another post.
Arrays get one partition per element kind: int[], long[], char[] and so on, since an int element never lives in a long[].
There are two wrinkles.
boolean[] and byte[] share a partition, because the JVM accesses both with the same instructions (baload and bastore).
And all arrays of references share a single Object[] partition, because Java arrays are covariant: a String[] can be passed around as an Object[], so a store through an Object[] may well land in a String[].
Everything else goes into one last partition, the rest of memory, written *.
It holds the JDK's own fields (there are thousands of them, and what we care about is the program's), plus memory that no field names at all, like the allocator's bookkeeping.
That's why an allocation touches *.
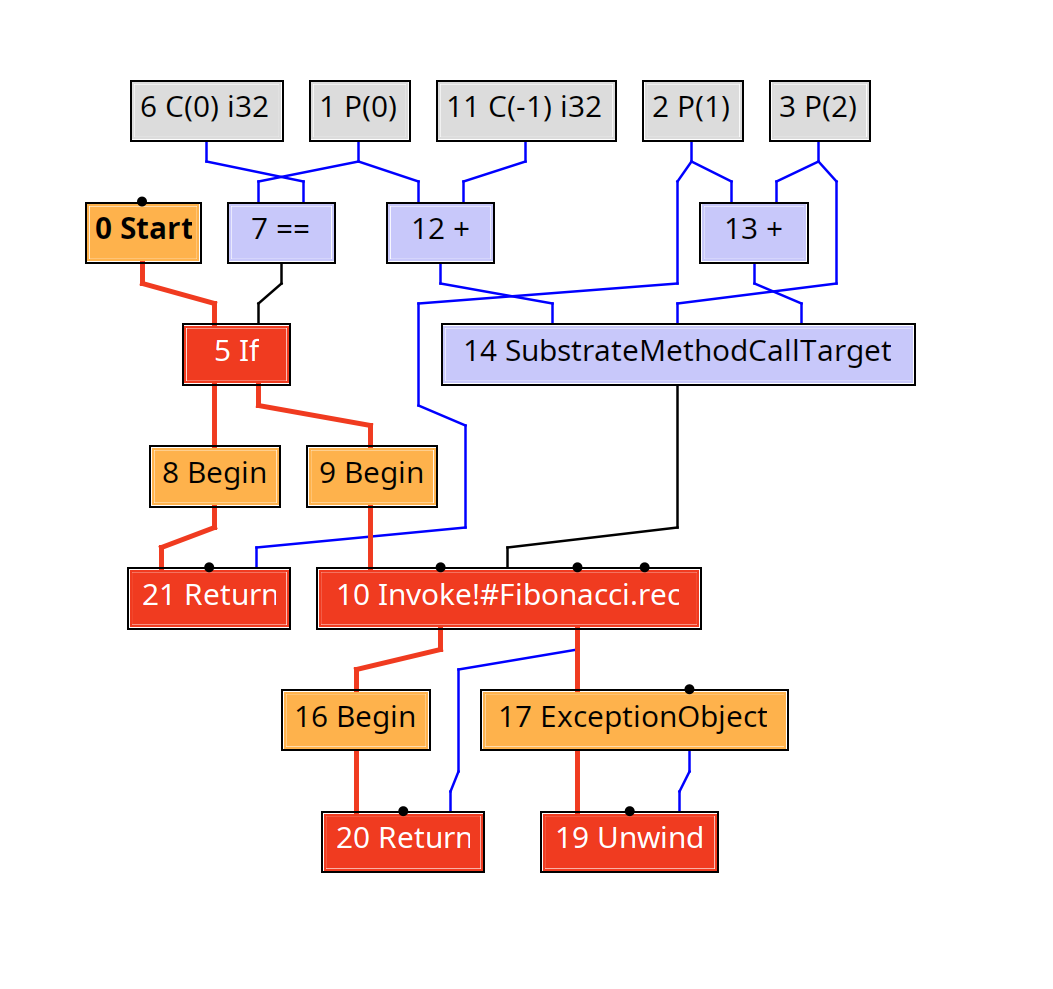
Here is the dead store from the SSU section again, this time as real code:
static void deadStoreOtherField(Counter counter) {
    counter.value = 1;   // dead
    counter.other = 7;
    counter.value = 2;
}
With a single heap token, all three stores form one chain, and the heap produced by the first store is consumed by the store to other, which doesn't overwrite value.
With a token per field, the chains come apart:
v1 ← store(v0, counter.value, 1)
o1 ← store(o0, counter.other, 7)
v2 ← store(v1, counter.value, 2)
The only use of v1 is another store to the same field, so nothing can ever observe the 1: the first store is dead.
Computing method signatures
Loads and stores know their partition from the field they access.
Calls are the interesting part.
A call has to take the token of every partition the callee might touch, including everything the callee calls in turn.
That set of partitions is the method's signature, and in Cthulhu it becomes the function's type: one heap token in and one out for each partition in the signature.
We compute signatures from the exported facts.
Every method starts with the partitions its own field and array accesses touch.
Then we keep adding the signatures of its callees, until nothing changes anymore.
This is where the points-to analysis comes in after all: it provides the call graph, so a virtual call contributes every method it may dispatch to.
Recursion is no problem.
The sets only ever grow and there are finitely many partitions, so the iteration has to stop.
Take a recursive method that counts the links of a list into a logger:
static void countInto(Logger logger, Link link) {
    if (link != null) {
        logger.count++;
        countInto(logger, link.next);
    }
}
It reads Link.next and reads and writes Logger.count, and its recursive call adds nothing new, so its signature is exactly those two partitions.
A caller passes it those two tokens and nothing else:
static int forwardAcrossWritingCall(Counter counter, Logger logger, Link list) {
    counter.value = 5;
    countInto(logger, list);
    return counter.value;
}
v1     ← store(v0, counter.value, 5)
n1, l1 ← countInto(n0, l0, logger, list)   -- Link.next, Logger.count
x, v2  ← load(v1, counter.value)
The load takes v1, which comes straight from the store, so it must read 5.
That's store-to-load forwarding, read directly off the data flow.
With one heap token, the call would sit between the store and the load, and we would have to load again.
Sometimes we simply don't know what a method does.
It may call a native method, which has no bytecode and therefore no facts.
The points-to analysis may have found no target for a call.
Or the method may do something the facts can't express in terms of fields: enter a monitor, access a volatile field, issue a memory fence, or poke at memory through Unsafe.
Monitors and volatiles don't write any particular field, but they order memory as other threads see it, so they have to stay ordered against everything.
In all of these cases the method touches everything: it takes every token, and so does every method that calls it, directly or not.
Unknown effects are never assumed absent.
That keeps the signatures sound, though not always precise.
And the precision is sobering: in a small test program whose reachable code, JDK included, has 1,734 methods, 1,034 of them still touch everything, mostly because somewhere down the call graph they reach a native method.
Teaching the analysis what common natives actually do is high on the list.